21: Change of Variables

Author

Derek Sollberger

Published

March 15, 2023

Linear Conversion

Let F be the daily high temperature in Fahrenheit in Merced, California, with a mean of 76 degrees and a standard deviation of 15 degrees. Compute those sample statistics in Celsius.

Temperature Conversion

We know that the conversion formula is

C=59(F32)

Range Rule of Thumb

Range Rule of Thumb

Recall

  • About 67 percent of data falls within one standard deviation of the mean
  • About 95 percent of data falls within two standard deviations of the mean

(μ2σ,μ+2σ)

We had computed

  • μF76 and σF15 degrees Fahrenheit
  • μC24.4444 and σC8.3333 degrees Celsius

Build range-rule-of-thumb intervals for the Merced high temperatures in Fahrenheit and in Celsius.

Distributions

Determine the distribution and density functions for

Y=59(X32)

Change of Coordinates

Change of Coordinates

Let X be a continuous random variable with distribution function FX and density function fX. If we apply a linear transformation

Y=aX+c

where a>0 and c are constants, then

FY(y)=FX(yca) and fY(y)=1afX(yca)

If XExp(1/2), then what kind of distribution does Y=32X have?

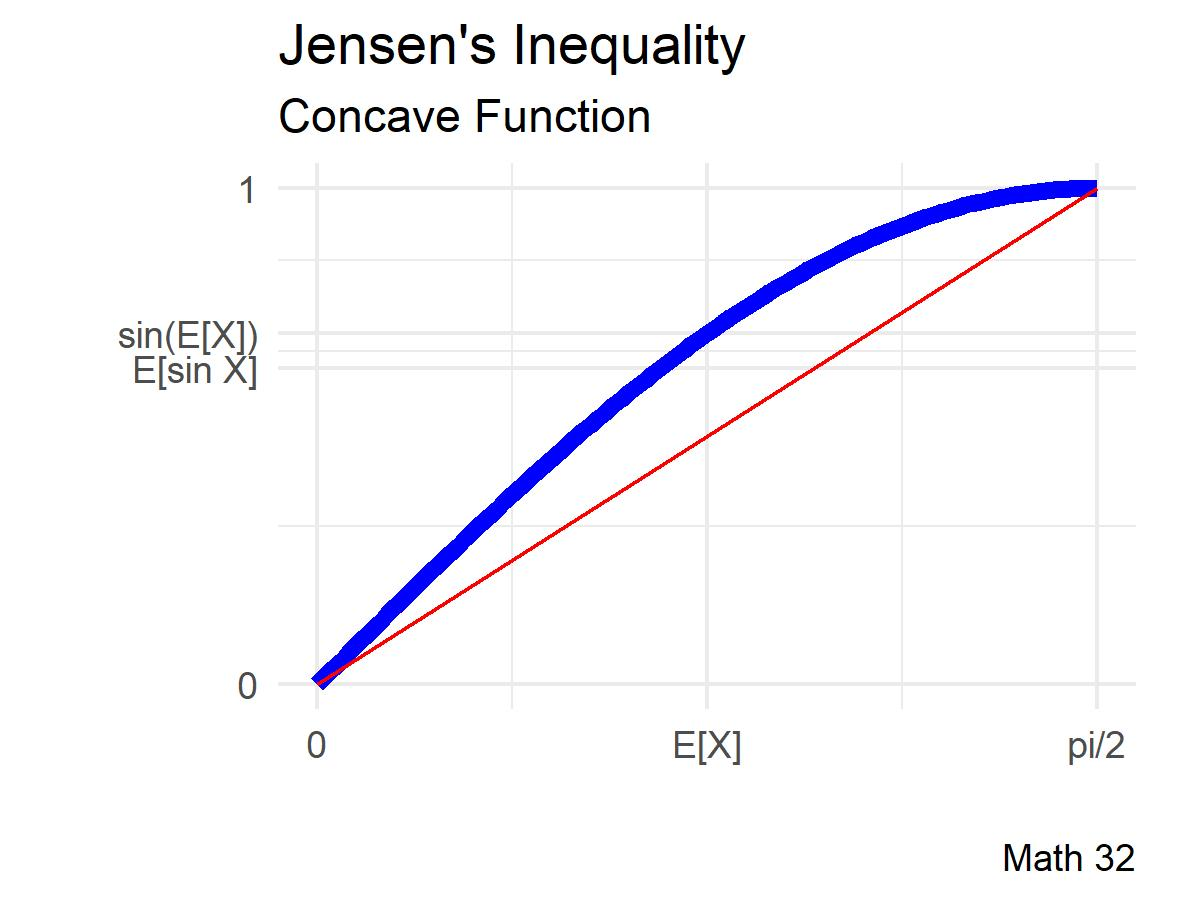
Nonlinear Transformations

Let XU(0,π2) and Y=sin(X).

Compare E[sinX] and sin(E[X])

Suppose that a disease outbreak can be modeled where X is the population density of a city and Y is the number of diagnosed cases with

XU(0,100),Y=X3.2

Compare E[X3.2] and (E[X])3.2

Jensen’s Inequality

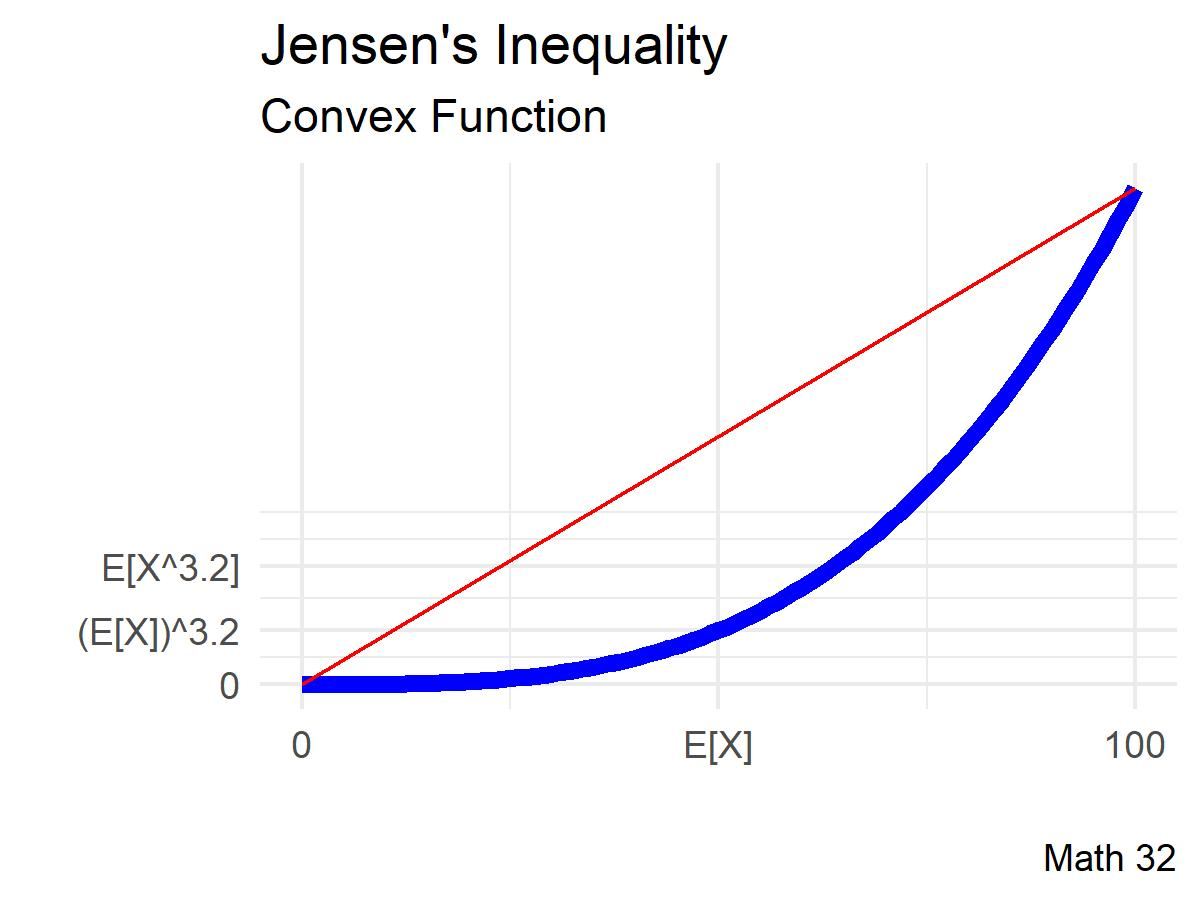
The previous two examples were demonstrations of , which states that

  • If g is a convex function of random variable X, then

g(E[X])E[g(X)] - If g is a concave function of random variable X, then

g(E[X])E[g(X)]

where the equal signs are not included when the function g is strictly convex or strictly concave.

Looking Ahead

  • due Fri., Mar. 17:

    • WHW8
    • LHW7
  • no lecture on Mar. 24, Apr. 3

  • Exam 2 will be on Mon., Apr. 10

Misc